Financial Highlights (Consolidated)
| Classification | 107th term (FY2021) |
108th term (FY2022) |
109th term (FY2023) |
110th term (FY2024) |
|---|---|---|---|---|
| Net sales(Millions of yen) | 103,289 | 100,578 | 108,298 | 117,491 |
| Operating profit(Millions of yen) | 2,218 | 3,156 | 5,623 | 8,912 |
| Operating margin(%) | 2.1 | 3.1 | 5.2 | 7.6 |
| Net profit(Millions of yen) | 1,544 | 1,794 | 3,797 | 5,717 |
| Total assets(Millions of yen) | 135,122 | 140,168 | 147,740 | 155,440 |
| Net assets(Millions of yen) | 77,349 | 78,537 | 86,079 | 92,088 |
| Equity ratio(%) | 56.9 | 55.6 | 57.8 | 58.8 |
| ROE(%) | 2.0 | 2.3 | 4.7 | 6.5 |
- Net sales (Millions of yen)

- Operating profit
Operating margin 
- Net profit (Millions of yen)

- Total assets
Net assets (Millions of yen) 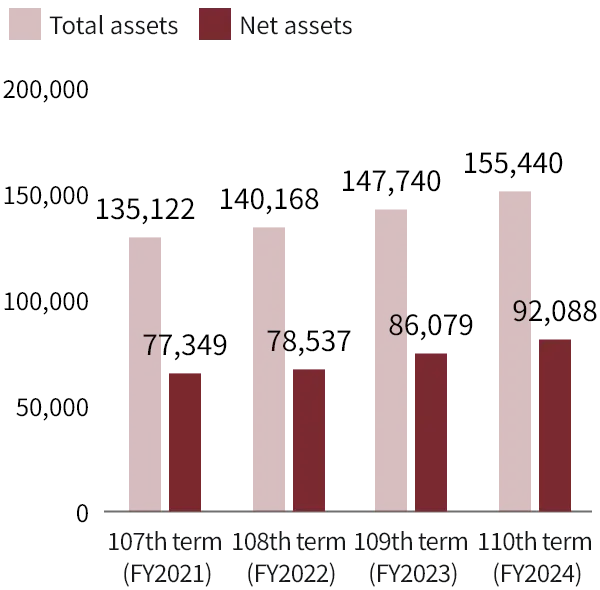
- Equity ratio (%)

- ROE (%)